Year
2024
Theme
Digital Cities, Senseable Cities Lab
Category
Research Analysis
Location
New York City, Amsterdam, and Singapore
Introduction
Urban Openness and Environmental Livability
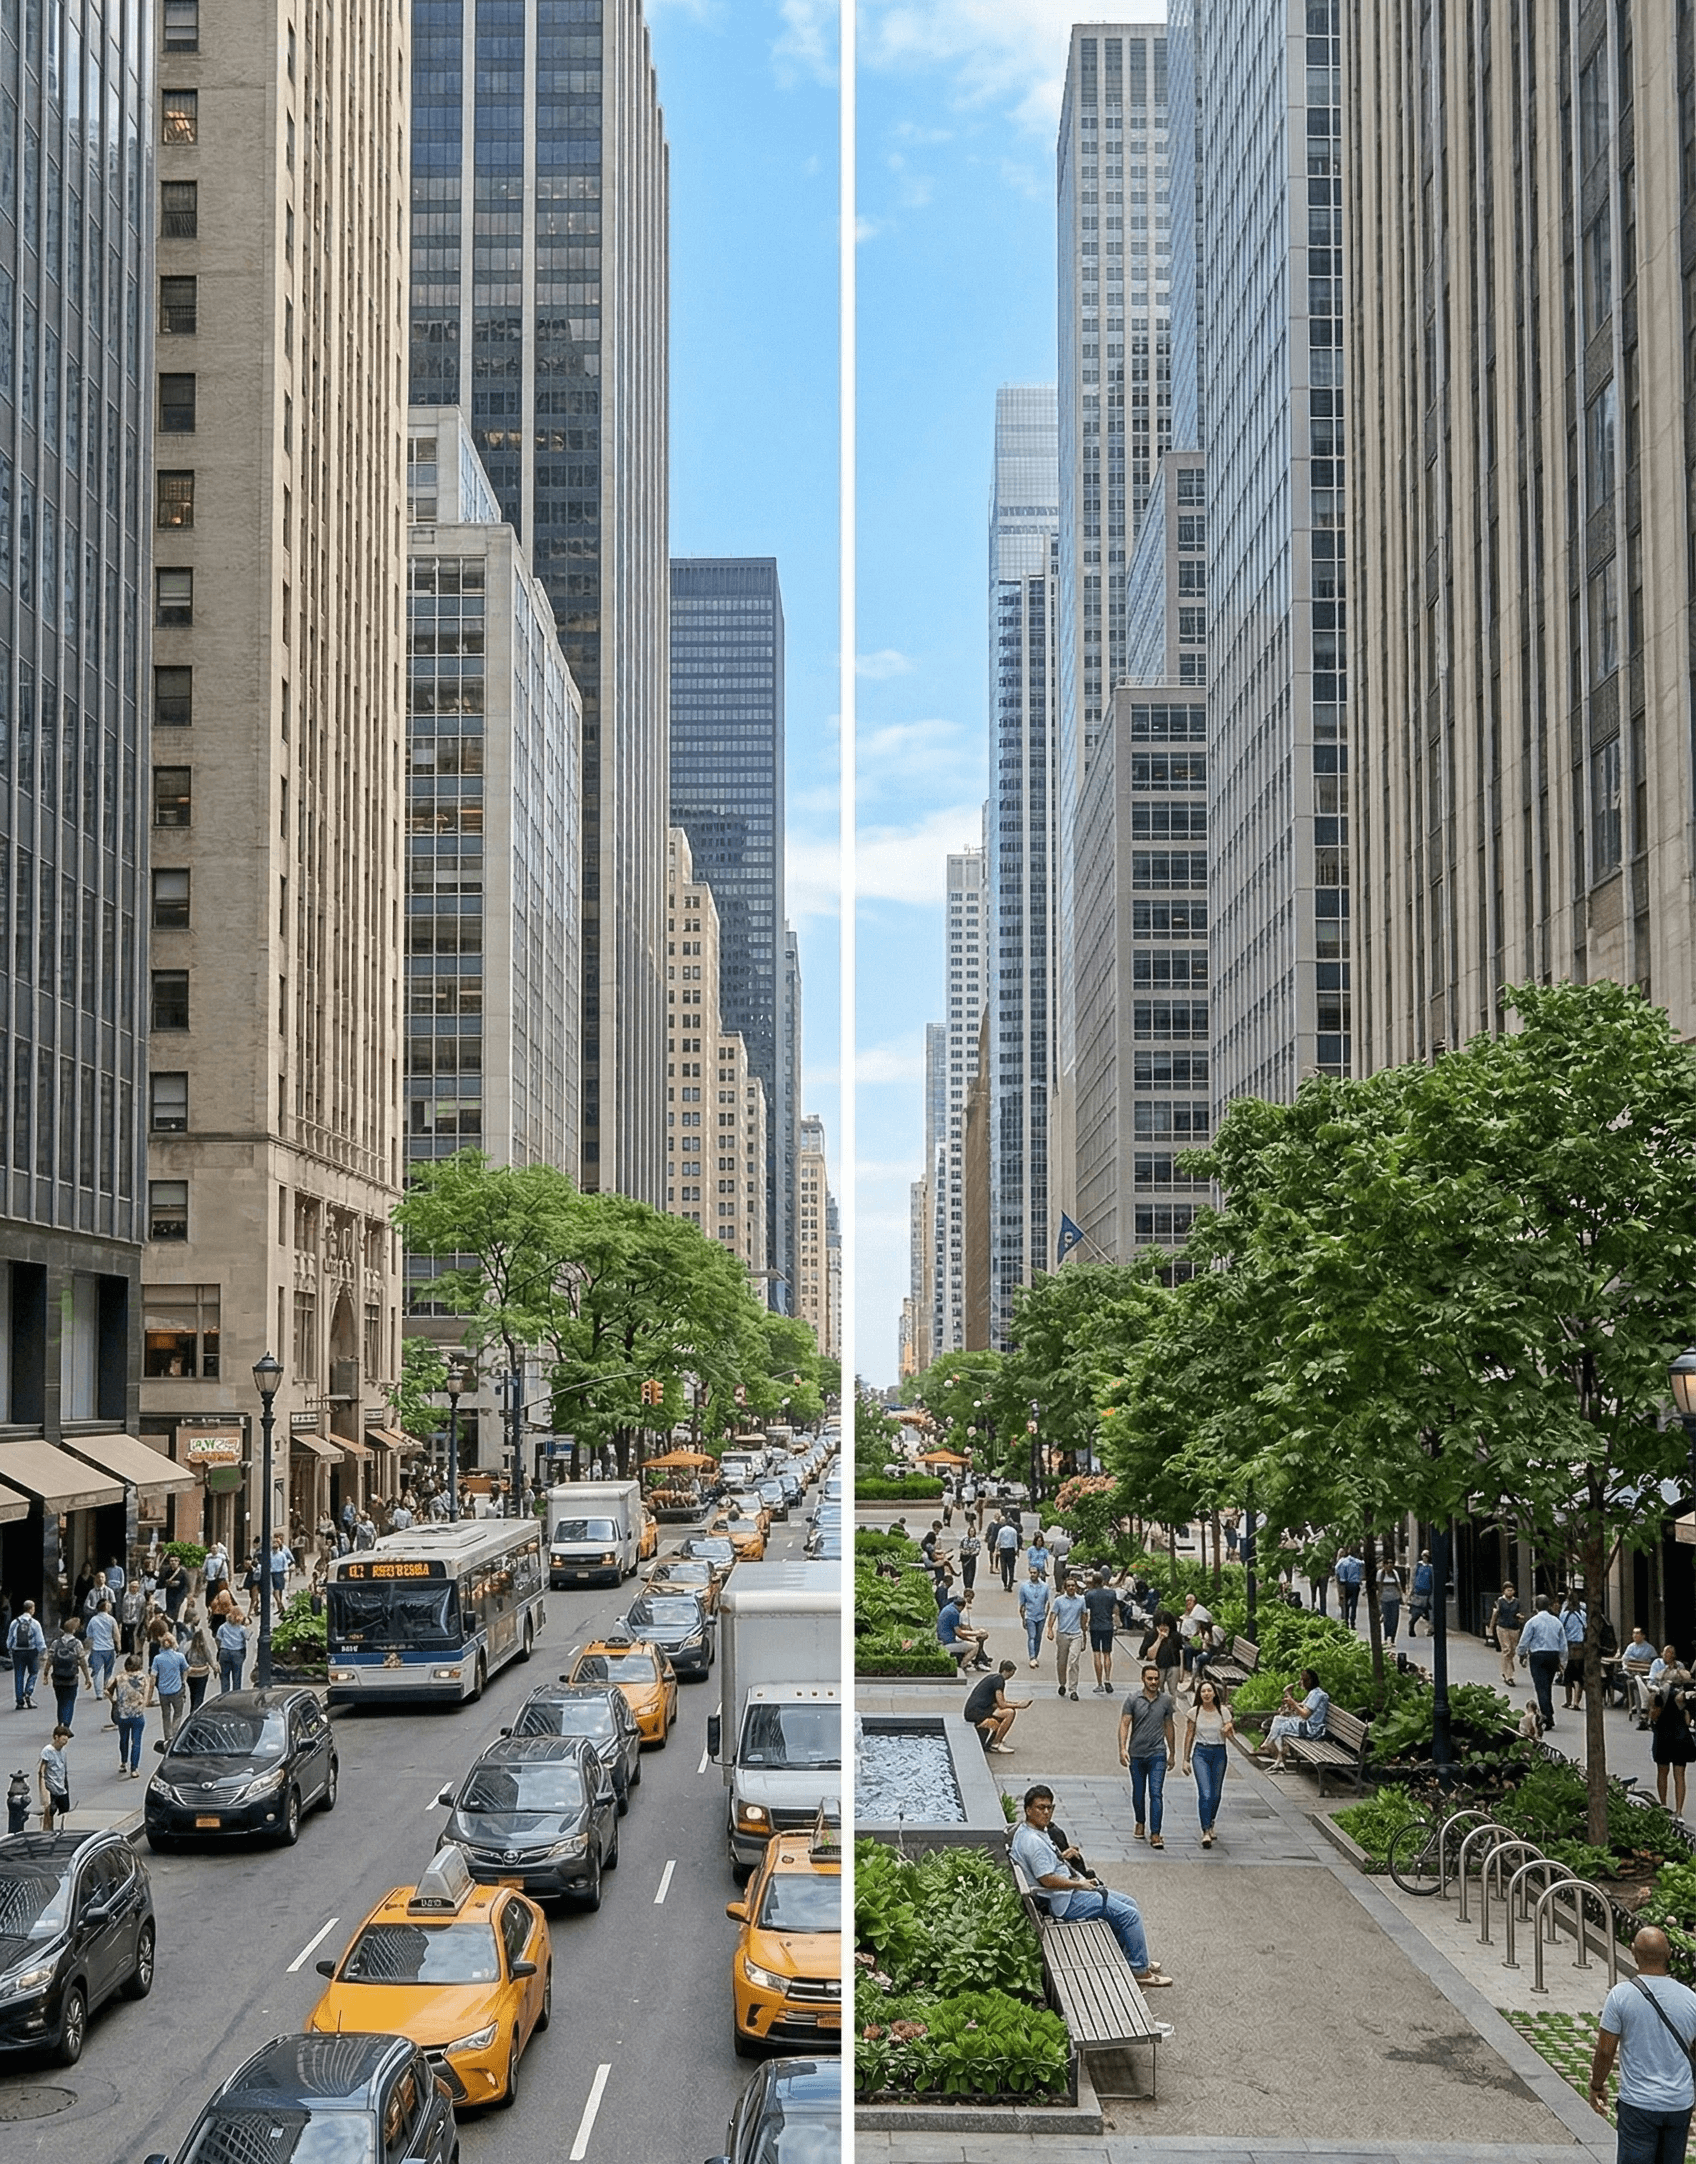
Developed at the MIT Senseable City Lab, the project investigates urban livability through the lens of street openness, analyzing how urban form influences environmental quality, thermal comfort, and social interaction across different city morphologies. Using computer vision, image segmentation, and spatial network analysis, the research compares street conditions in New York City, Amsterdam, and Singapore through large-scale visual and geographic datasets derived from Google Street View imagery and OpenStreetMap networks. Rather than understanding openness only as a geometric condition, the project approaches it as a spatial relationship between sky visibility, vegetation, mobility, pedestrian activity, and environmental comfort within the street environment.
Challanges
Translating Spatial Experience into Measurable Data
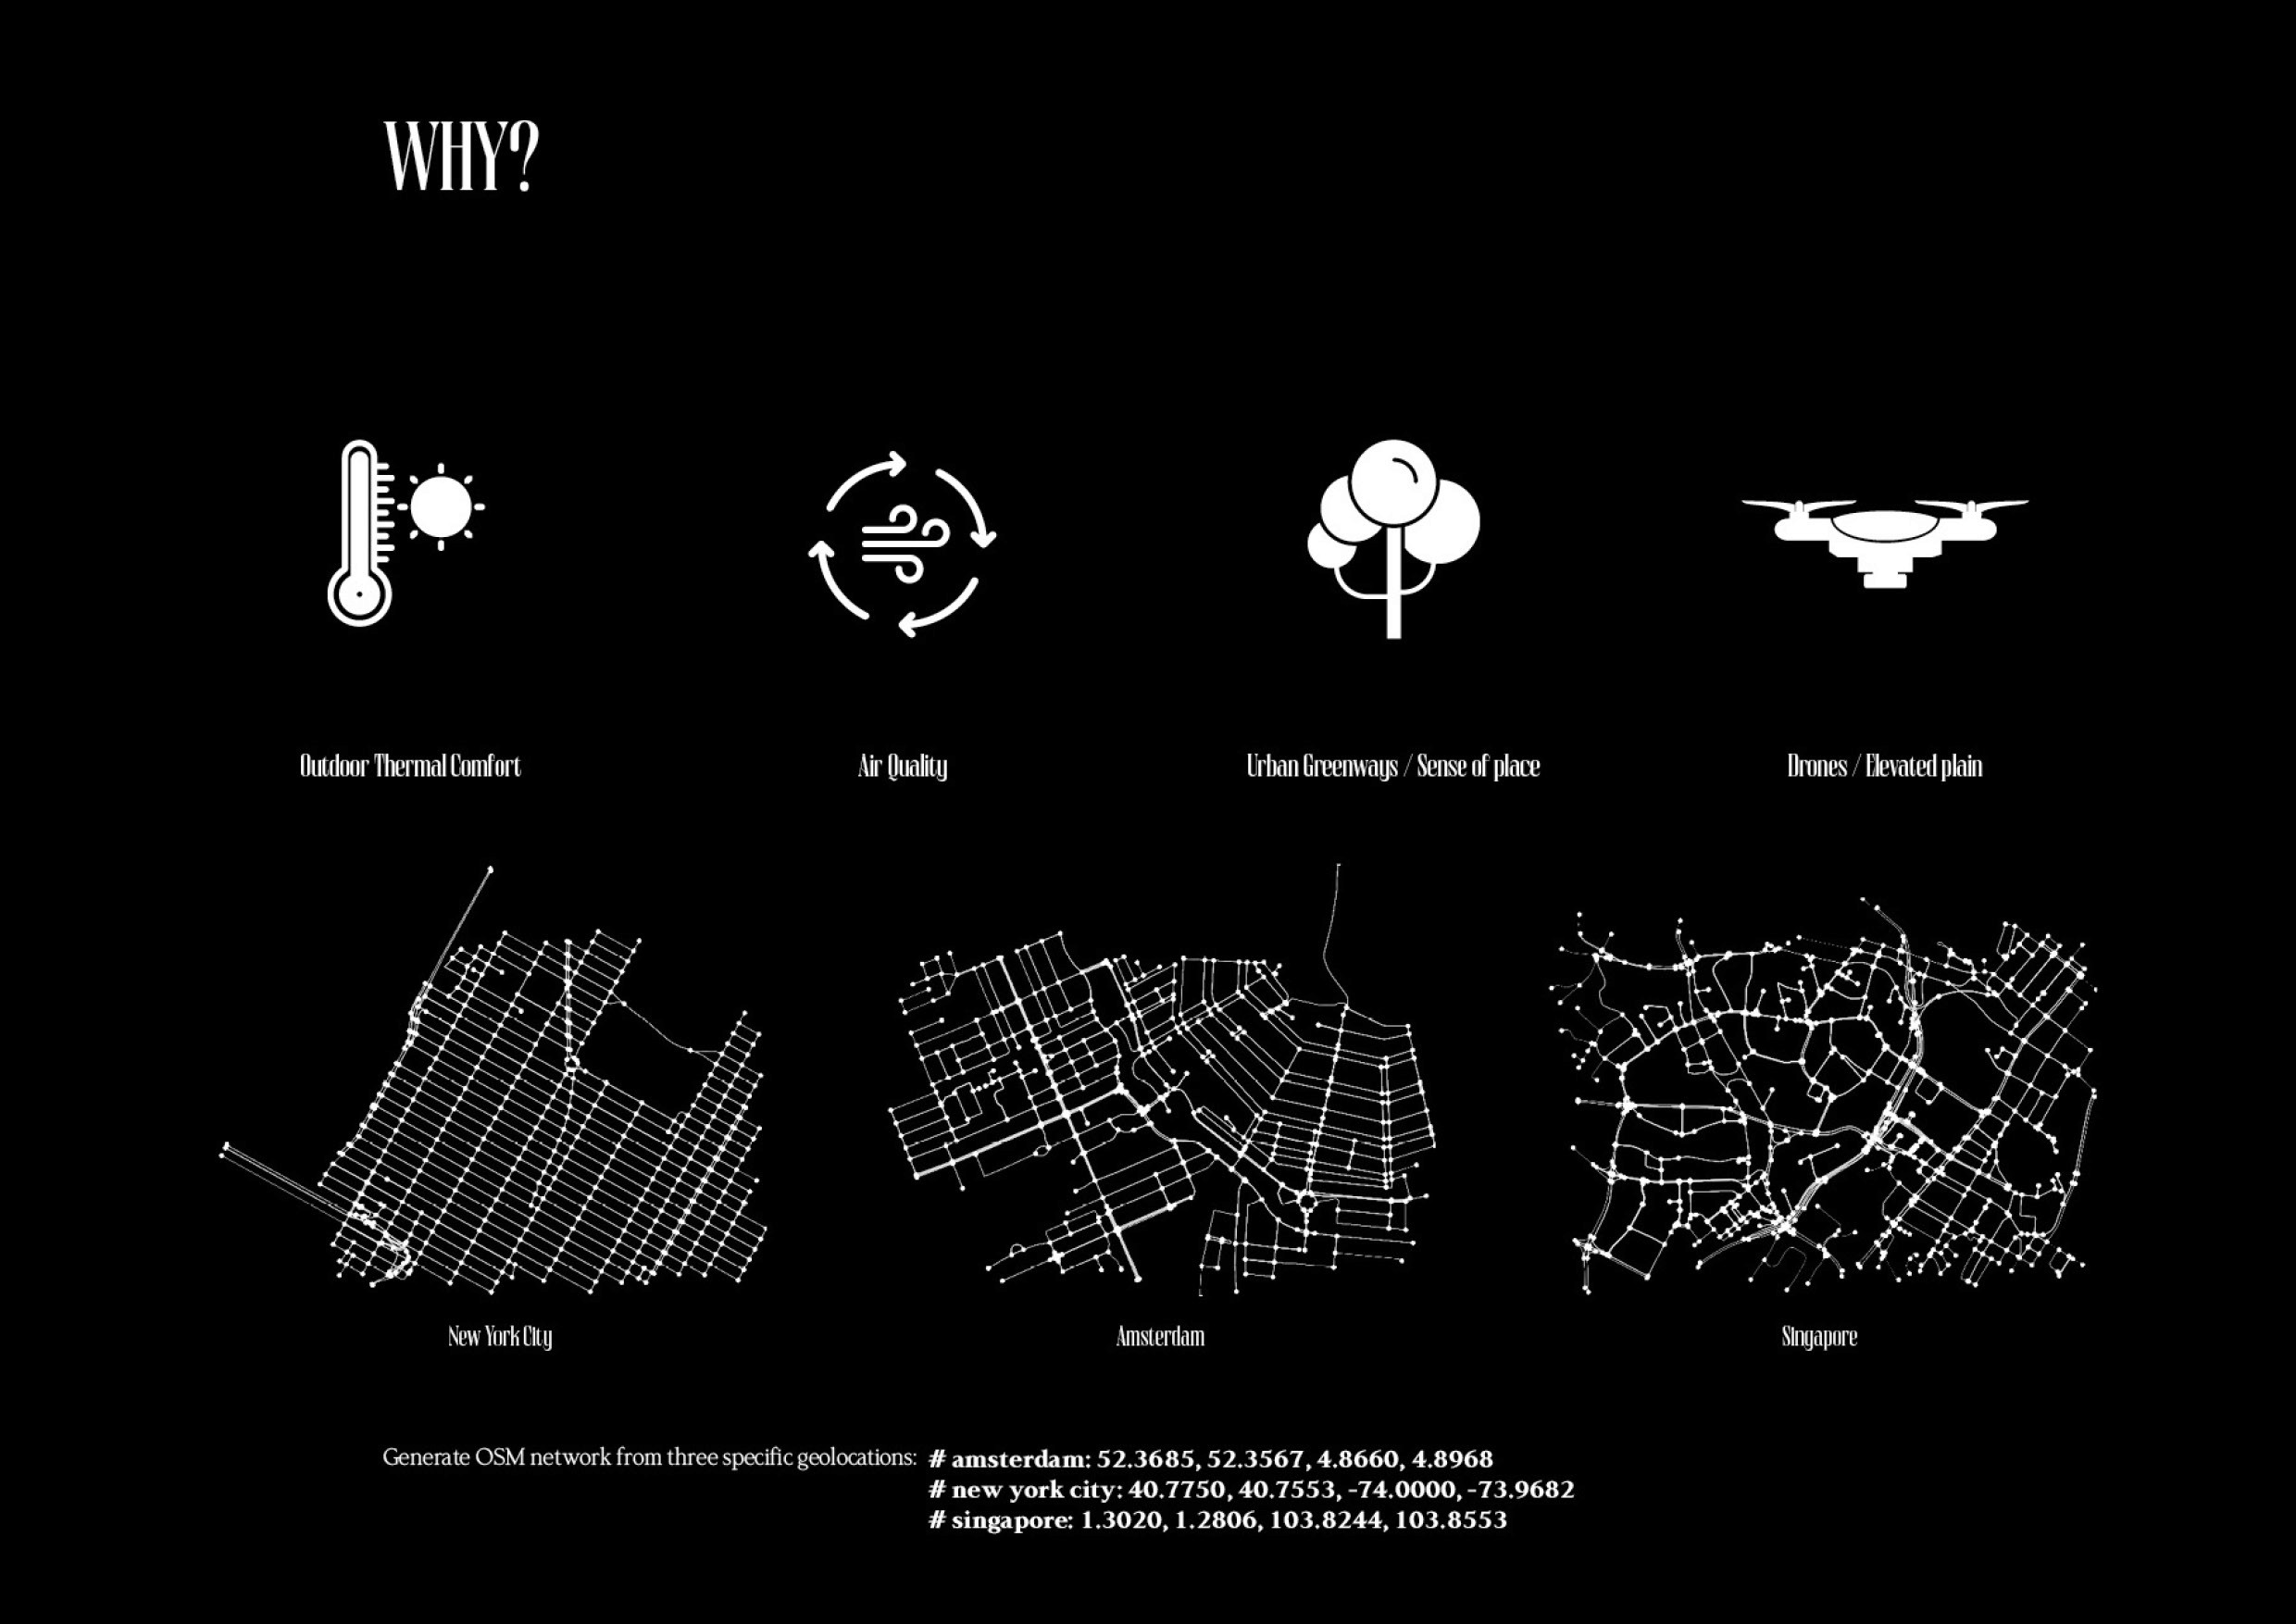
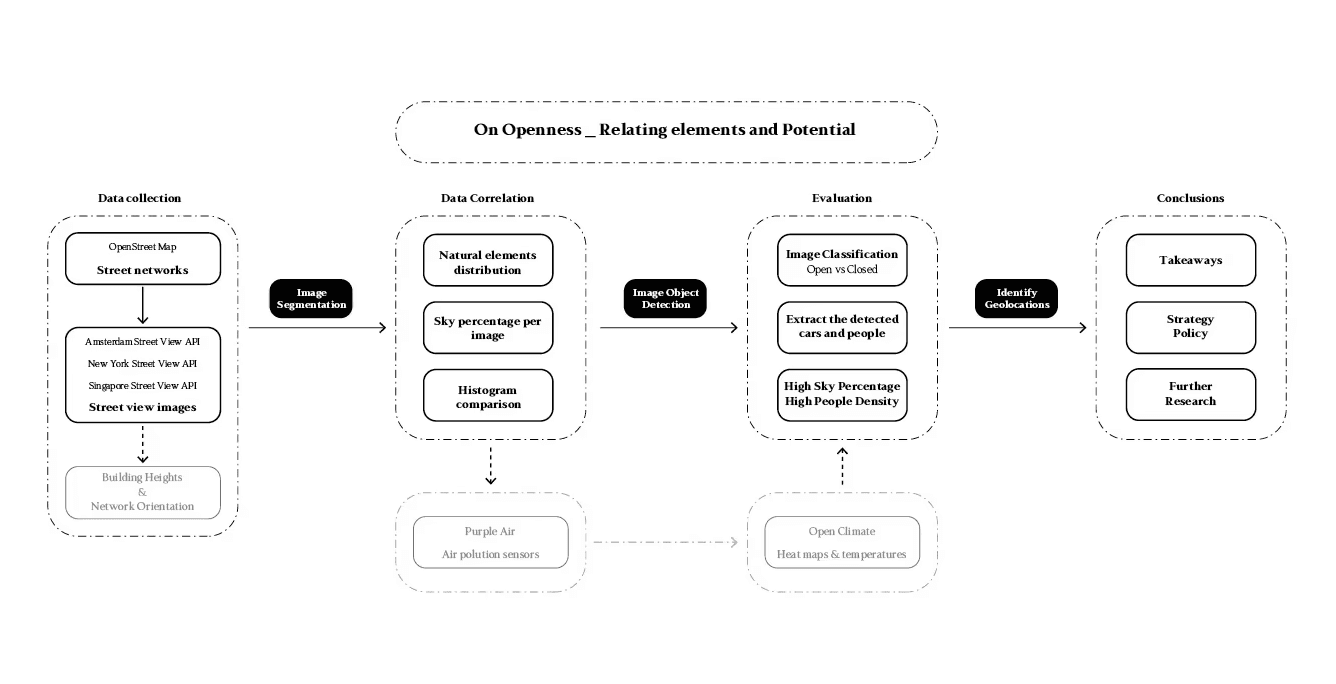
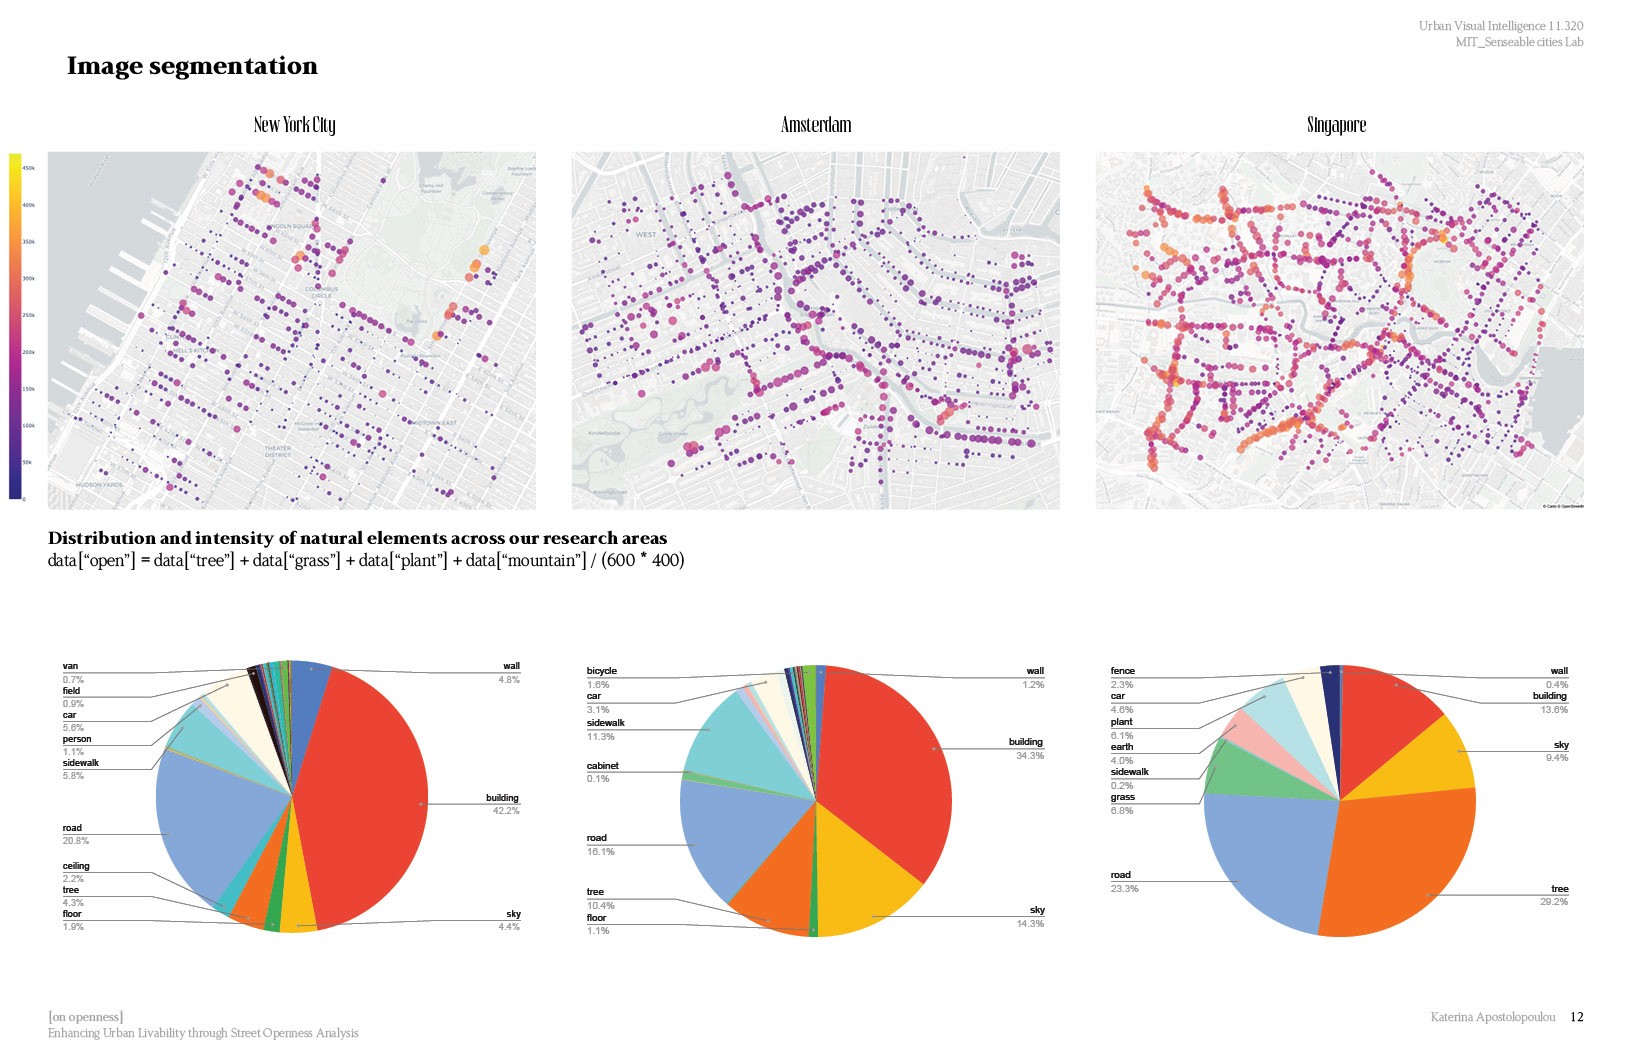
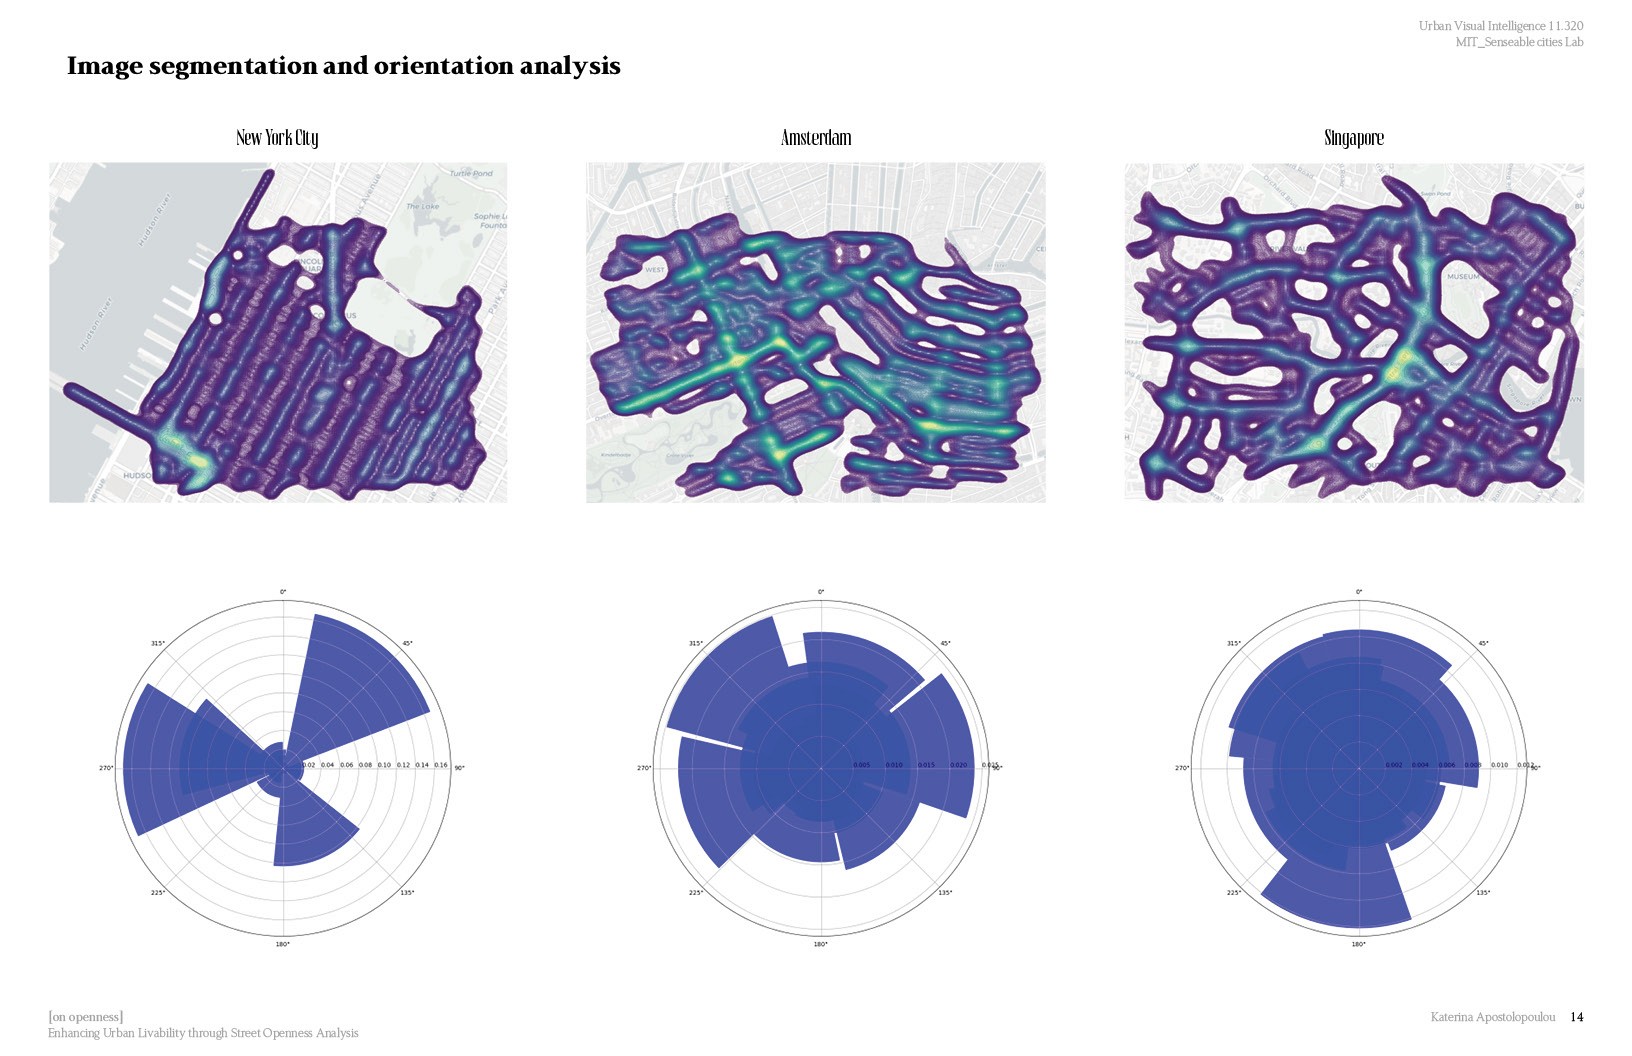
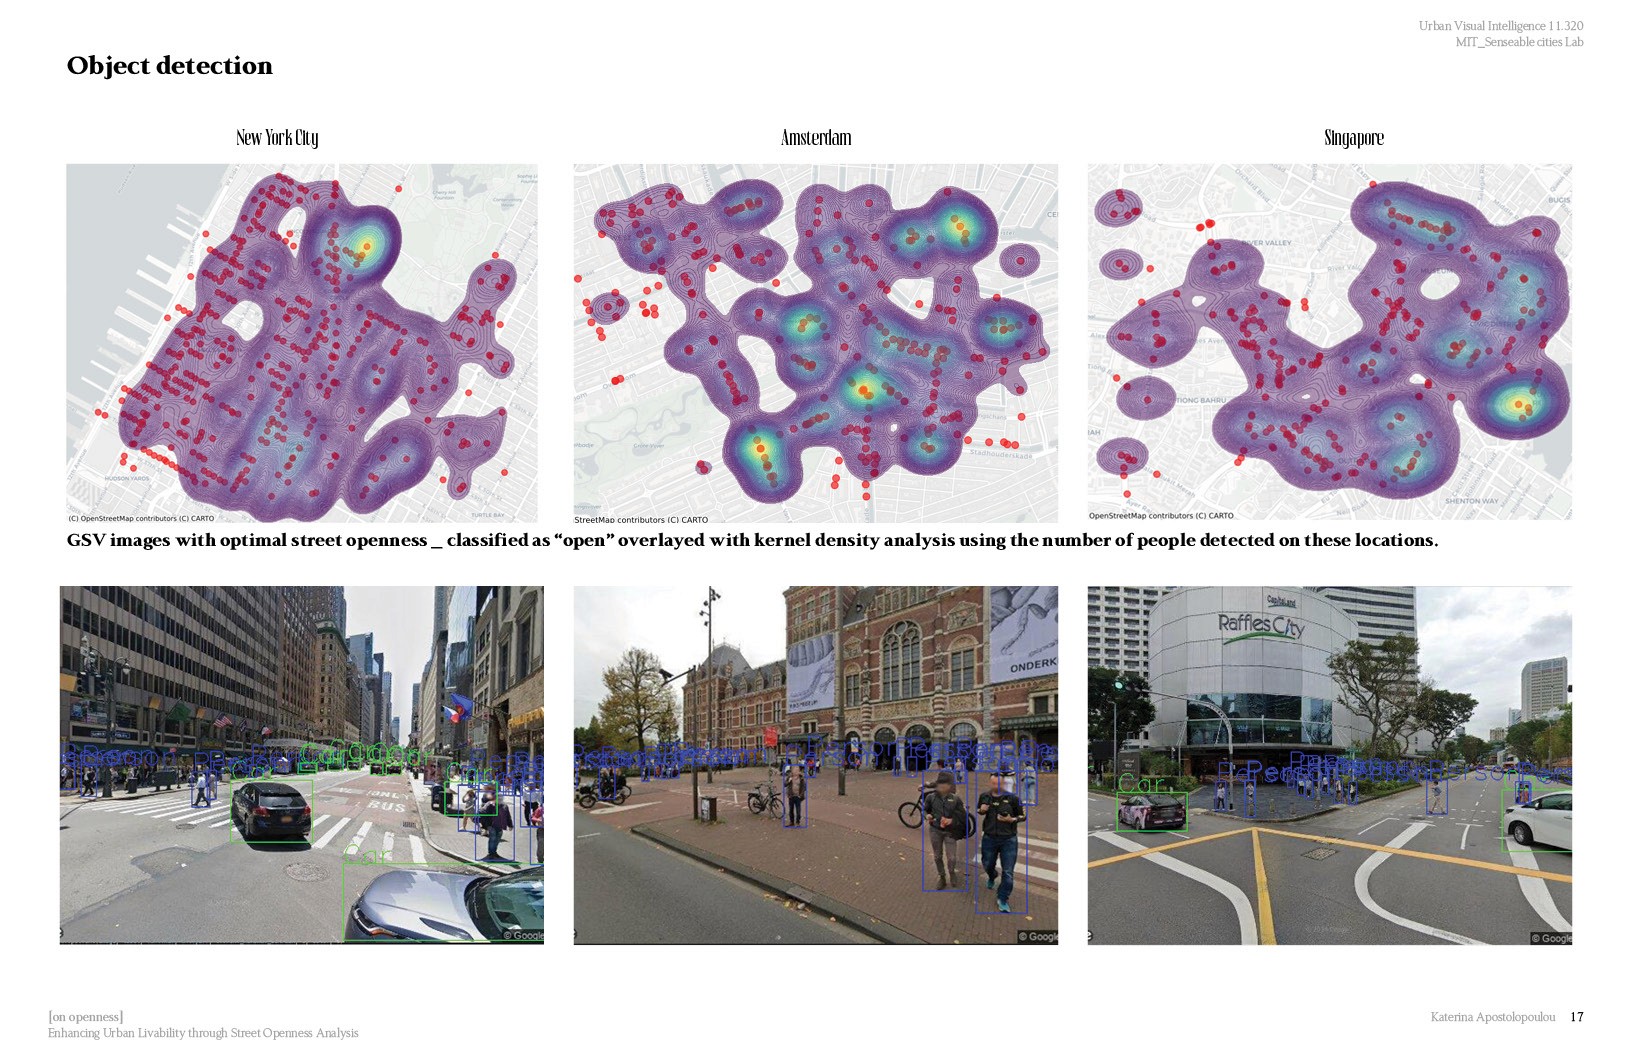
One of the project’s central challenges was transforming qualitative spatial experiences into measurable urban indicators while maintaining comparability across very different urban contexts. The methodology combined street network extraction, image segmentation, orientation analysis, and object detection workflows in order to evaluate relationships between vegetation coverage, street orientation, pedestrian density, and environmental openness. Semantic segmentation models were used to identify trees, grass, sky visibility, and built surfaces across thousands of street images, allowing the research to quantify environmental exposure and ecological presence throughout the urban fabric. These datasets were then correlated with pedestrian activity and mobility patterns through density mapping and object detection analysis. The comparison between New York, Amsterdam, and Singapore revealed distinct spatial behaviors linked to density, orientation, vegetation distribution, and climatic adaptation. Amsterdam’s lower-density and canal-centered structure produced more continuous environmental openness, while New York’s vertical concentration and Singapore’s dense vegetation generated different forms of visual enclosure and spatial compression. By combining computational analysis with urban design thinking, the project develops a scalable framework for evaluating how morphology and environmental conditions shape everyday urban experience.
Final thoughts
Computational Tools as Urban Reading Devices
The research demonstrates how computer vision and geospatial analysis can reveal hidden relationships between urban form, environmental comfort, and public life. Rather than replacing architectural intuition, these computational methods operate as analytical tools capable of supporting future urban strategies related to walkability, climate adaptation, air quality, and public space design. Ultimately, the project positions urban data not only as technical information, but as a way of reading cities through their environmental, spatial, and social conditions, helping inform more responsive and human-centered urban environments. Key Skills Geospatial Analysis: Processed urban data using OpenStreetMap and Google Street View APIs. Computer Vision: Applied image segmentation and object detection (YOLO) to evaluate urban features. Data Visualization: Created heatmaps and density plots for insights into urban patterns. Urban Design Integration: Combined data-driven analysis with planning principles for actionable interventions. Programming: Automated workflows and data analysis in Python using libraries like Seaborn, Folium, and Pandas.

(03)
PROJECTS